When you or someone you love gets a cancer diagnosis, you're suddenly dropped into a world of complex information. There are treatment probabilities, clinical study results, and endless percentages to make sense of. This guide is here to help you navigate it all by explaining cancer research and biostatistics, the science that turns raw data into life-saving decisions.
Think of it as the instruction manual that helps doctors figure out which treatments work best, for whom, and why.
It’s completely normal to feel swamped by the sheer volume of numbers and medical terms that come with a cancer diagnosis. From pathology reports to clinical trial updates, data is everywhere. But these aren't just abstract figures; they are the very foundation of the care plan you receive and hold the key to future breakthroughs.
This guide is designed to cut through the jargon. We want to give you clarity and confidence, so you can better understand your treatment options and play a more active role in decisions about your health. For example, learning to interpret common reports, like understanding your blood count test results, is a powerful first step.
Getting a handle on the basics of biostatistics helps you grasp the "why" behind your treatment plan. It’s the science that proves a new therapy works, ensuring medical advice is based on solid evidence, not just a hunch. Every single major advance in cancer treatment has been built on careful statistical analysis.
A little bit of knowledge here can help you:
The real job of biostatistics in cancer care is to take overwhelming data from thousands of patients and find clear, reliable insights that can improve the outcome for one single patient—you.
Ultimately, biostatistics is the bridge from a discovery in a lab to an effective treatment in the clinic. The principles of laboratory medicine, for instance, generate the crucial data that biostatisticians then sift through to find meaningful patterns.

To get us started, here’s a quick overview of the essential terms we'll be exploring in this guide. Think of this as your cheat sheet for understanding the language of cancer research.
| Concept | What It Means for Your Care |
|---|---|
| Clinical Trial Design | This is the blueprint for a study. It ensures the results are fair and reliable, which is how we know a new treatment is genuinely better than an old one. |
| Survival Analysis | It's more than just a number. This tells us how long a treatment helps patients live or keeps a cancer from returning, giving a clearer picture of its true benefit. |
| P-Values | A tiny number with a big job. It helps researchers decide if a study's result is a real breakthrough or just down to chance. |
| Confidence Intervals | This gives us a realistic range for a study's results, showing how much certainty we can have in the findings and what they might mean for a larger group of patients. |
| Bias | This is anything that could skew a study's results and lead to the wrong conclusion. Spotting it is crucial for trusting the science behind your treatment. |
Don't worry if these terms still seem a bit fuzzy. We're going to break down each one, step-by-step, so you can see exactly how they connect to the care you or your loved one receives.
At its heart, biostatistics is the science of asking and answering critical health questions using data. In the world of cancer research, it’s the engine that powers almost every single breakthrough. It gives us the structured methods we need to turn overwhelming amounts of information into reliable knowledge that can save lives.
Imagine researchers have a promising new drug. They'll collect a mountain of data – how tumours respond, which side effects appear, how long patients live. Biostatistics provides the essential tools to make sense of it all, spot the important patterns, and figure out if the drug’s benefits are real or just down to chance. It’s what separates wishful thinking from hard evidence.
Without it, cancer research would be like sailing without a compass. We'd be adrift in a sea of data with no clear direction.
Let's think of it like a carefully planned gardening experiment. Say you want to test a new fertiliser to see if it makes roses grow bigger and brighter. You wouldn't just chuck it on a few random plants and hope for the best, would you? To get an answer you can trust, you need a proper plan.
You’d have to figure out:
Biostatisticians tackle these exact same types of questions, but for cancer research. They design clinical trials to be fair and robust, calculating the precise number of patients needed to get a credible result. Their work ensures that the conclusions drawn from research are as accurate and valid as possible.
Biostatistics is the specialised field that transforms raw data from studies into clear insights an oncologist can use to recommend the best course of action for their patient. It is foundational to discovering, testing, and delivering new cancer therapies.
This methodical, rigorous approach is so important because the stakes couldn't be higher. The answers that biostatistics helps us find directly shape the standard of care for millions of people around the world. When a new treatment gets approved, it’s because a painstaking statistical analysis has proven its benefit beyond a reasonable doubt.
This whole process ensures that the care you or your loved one receives is based on the strongest possible evidence. The goal is always to find treatments that are not only effective but also safe, with benefits that clearly outweigh any risks.
Ultimately, the careful work of biostatisticians helps build a future where every patient has access to the most effective treatments science can offer. This dedication to rigour is essential when you're choosing a cancer centre for precision treatment, as the best facilities are deeply committed to this kind of evidence-based research.
When you hear about a new cancer study, it's natural to wonder how much weight you can give the results. The truth is, not all studies are created equal. In cancer research, the design of a clinical trial is the absolute bedrock of its credibility—it's what separates a genuinely trustworthy finding from a potentially misleading one. The ultimate goal is to get a clear, unbiased answer to a single, vital question: is this new treatment truly better than what we already have?
To get that answer, researchers rely on a powerful framework known as the randomised controlled trial, or RCT. Think of it as the ‘gold standard’ in medical research. Why? Because it’s meticulously built to strip away bias and give us the most reliable results possible. Understanding how an RCT works is the key to cutting through the hype and interpreting news about medical breakthroughs with real confidence.
Let's imagine a study testing a new heart-healthy diet. If you simply let people choose whether they want the new diet or their usual one, you'd quickly run into trouble. The most health-conscious people would probably jump at the new diet, and they might have better outcomes just because they already exercise more or smoke less. This creates bias, a statistical gremlin that can warp the results and make the diet seem far more effective than it really is.
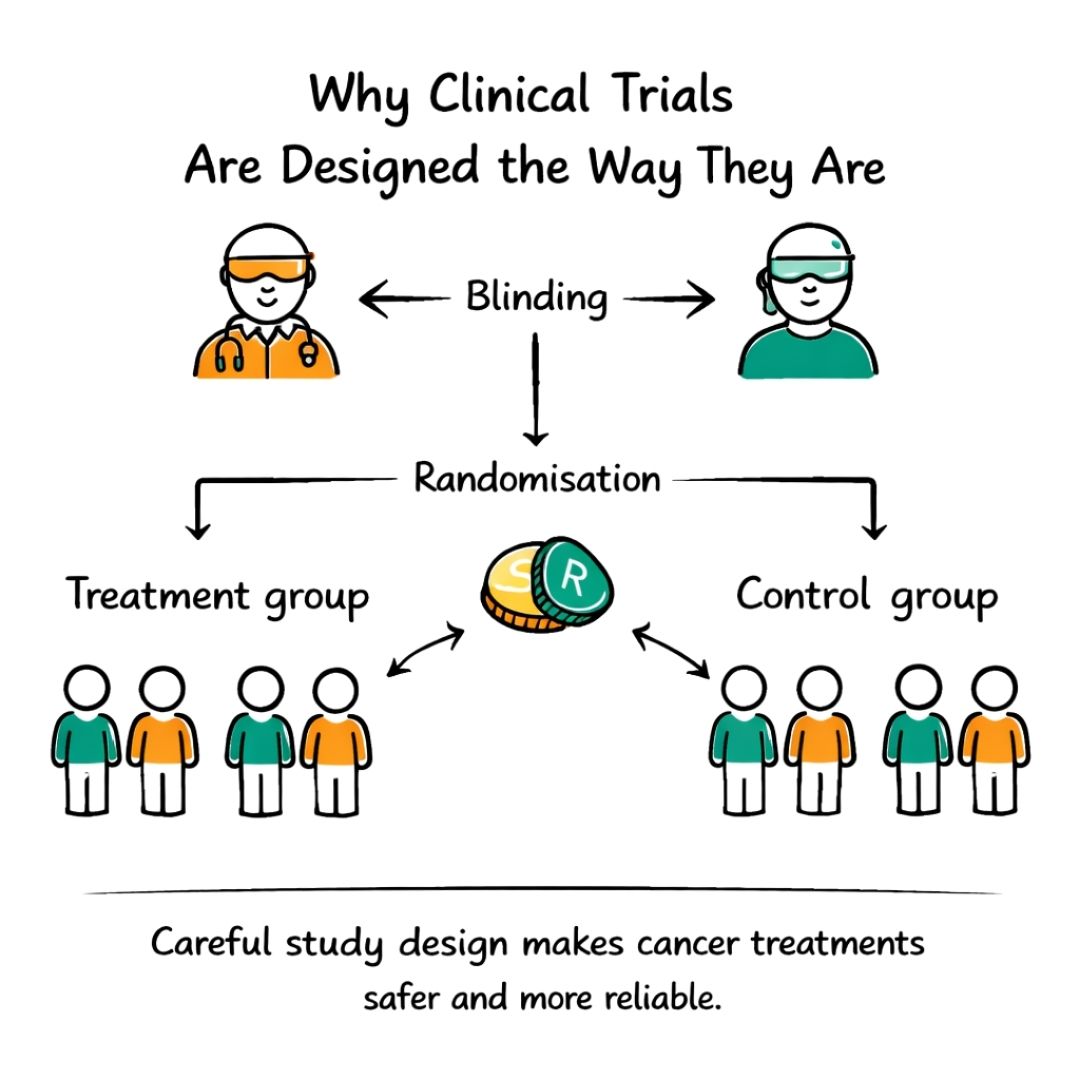
Randomisation is the elegant solution to this problem. In an RCT, participants are assigned to different groups purely by chance, essentially, like the flip of a coin. This simple act ensures that, on average, the groups are as similar as possible in every way that matters, from age and overall health to other lifestyle factors.
This is a cornerstone of cancer research and biostatistics. By randomising, we can isolate the one thing we're testing, the new treatment, and be much more certain that any differences we see between the groups are actually because of the treatment itself, not some other hidden variable.
A proper RCT always has at least two groups:
To add another layer of rigour, many trials use a technique called blinding. In a single-blind study, the participants don't know which treatment they’re getting. In a double-blind study, a step further, neither the participants nor their doctors know.
Blinding is critical because it prevents our expectations—both as patients and clinicians—from influencing the results. It helps ensure that improvements or side effects are measured objectively, leading to conclusions we can truly depend on.
A well-designed trial gives you and your care team confidence that a new treatment's reported benefits are genuine. It’s what helps us sift real progress from hopeful but unproven ideas. This rigour also extends beyond individual trials. Biostatisticians analyse data from national cancer registries to spot important trends across the entire population. For instance, age-adjusted data reveals that cancer incidence rates have climbed in the UK since the early 1990s. This kind of large-scale analysis informs research priorities and shows just how urgently we need these meticulously designed trials.
This commitment to rigour is why new treatments take time to become widely available. To dig deeper into the practicalities, you can explore detailed discussions on how clinical trials are designed for different therapies. And if you're considering taking part in a study, our guide on what to expect can shed light on the clinical trial process.
When a news story breaks about a new cancer study, it often comes packed with terms like ‘p-value’, ‘survival rate’, or ‘hazard ratio’. It can feel like trying to decipher a foreign language, but getting a handle on these concepts is the key to understanding the research that shapes modern cancer care.
Think of each of these statistical terms as a different piece of a puzzle. Together, they help researchers, doctors, and you understand not just if a new treatment works, but how well it works, for how long, and how confident we can be in that result. Let’s translate what these phrases actually mean when you’re trying to make sense of your options.
The term survival analysis might sound a bit stark, but it’s actually an incredibly powerful tool in cancer research and biostatistics. It’s not just about a final timeline. It’s a method for looking at the probability of a certain outcome, like being cancer-free, over a specific period.
A common example is the "five-year survival rate". This simply shows the percentage of patients in a study who were still alive five years after their diagnosis or after starting their treatment. It’s a standard benchmark for measuring a treatment's long-term success.
The p-value is probably one of the most common, yet most misunderstood, terms in medical research. In a nutshell, it’s a tool that helps scientists figure out if their results are likely real or just a fluke.
Imagine you flip a coin 10 times and it lands on heads every single time. You’d start to suspect that the coin is weighted, right? The p-value is the mathematical version of that suspicion. A small p-value (typically less than 0.05) suggests that what you’re seeing, like a new drug shrinking tumours better than an old one, is very unlikely to have happened by random chance alone.
A low p-value gives researchers confidence that their findings are "statistically significant." It's a signal that the effect they've observed is probably real and worth paying attention to.
It's crucial to remember, though, that a p-value doesn't tell us how big or important the effect is. It only tells us that it’s probably not a coincidence.
A single number, like a survival rate, is useful but doesn't paint the full picture. That’s where confidence intervals (CIs) come into play. A good way to think of a CI is as a 'range of likely results'.
For instance, if a study finds a new drug has a 70% response rate, the 95% confidence interval might be 65% to 75%. This means that while the study found a 70% rate, researchers are 95% certain that the true rate for all similar patients out in the world falls somewhere in that range. A narrower range points to a more precise and reliable result.
When a study compares two treatments, say, a new drug versus the standard of care, you'll often see a hazard ratio (HR). This number summarises how the rate of a particular outcome (like the cancer progressing) in the new treatment group compares to the rate in the control group over the entire study period.
Here’s a simple way to read it:
Getting familiar with these core concepts can empower you to look at research findings with a more critical eye. It equips you to have much deeper, more meaningful conversations with your healthcare team about what the numbers really mean for you.
To help you keep these terms straight, we’ve put together a simple glossary.
| Statistical Term | Simple Explanation | Why It Matters to Patients |
|---|---|---|
| Survival Rate | The percentage of people in a study who are still alive for a certain period of time (e.g., 5 years) after diagnosis or treatment. | It provides a benchmark for a treatment's long-term effectiveness and helps you understand the general prognosis. |
| P-Value | A measure of how likely it is that an observed result happened by random chance. A small p-value (e.g., <0.05) suggests the result is "real". | It helps confirm if a difference between two treatments is genuine and not just a fluke, adding confidence to the study's conclusions. |
| Confidence Interval (CI) | A range of values that likely contains the "true" value for the entire patient population. A 95% CI is the most common. | It shows how precise the study's results are. A narrow range is more reliable than a very wide one. |
| Hazard Ratio (HR) | Compares the rate of an event (like disease progression) in a treatment group to a control group. A ratio below 1.0 favours the new treatment. | It gives you a single number to quickly see if a new treatment reduces the risk of a bad outcome compared to the standard treatment. |
Hopefully, this table makes these concepts a little less intimidating. The goal isn’t to become a statistician overnight, but to feel more confident when you encounter these terms in articles or during appointments.
We're seeing a major shift in cancer care, moving away from one-size-fits-all treatments towards highly individualised plans. Biostatistics isn't just a background tool anymore; it’s right at the heart of this change, driving the personalised medicine revolution. It’s what gives us the power to match the right treatment to the right patient at precisely the right time.
This isn't just about general trial results. The real work of cancer research and biostatistics today focuses on the unique characteristics of a person's individual cancer. The aim is to base treatment decisions not just on where the cancer is, but on its unique biological fingerprint.
One of the most powerful contributions of biostatistics is in identifying biomarkers. You can think of these as unique genetic or molecular signals within a tumour that tell us how it's likely to behave. Biostatisticians use sophisticated statistical models to hunt through massive datasets from genomic sequencing and clinical trials.
Their analysis can uncover a direct link between a specific gene mutation and a drug's effectiveness. For instance, a statistical model might reveal that melanoma patients with the BRAF V600E gene mutation respond incredibly well to a certain targeted therapy, while those without it don't.
Finding these links involves a few key steps:
By uncovering these crucial biomarkers, biostatistics essentially gives doctors a predictive roadmap. It helps them tailor treatments to an individual’s cancer profile, which can dramatically increase the odds of success while helping patients sidestep therapies that simply won’t work for them.
This is a huge step forward. It means patients can be spared the physical and emotional burden of ineffective treatments and their side effects. If you'd like to see how this is being applied, you can read more about how a groundbreaking tool is bringing personalised chemotherapy closer to reality.
Biostatistics also plays a critical role in planning for the future, well beyond the initial treatment. By analysing data from thousands of patients with similar cancers and stages, statistical models can build highly personalised risk profiles.
These models weigh up various factors to predict the chances of a cancer returning after treatment has ended. They might look at:
This kind of statistical forecasting helps shape a patient's follow-up care. Someone with a high-risk profile, for example, might be scheduled for more frequent scans or check-ups. On the flip side, a person with a very low-risk profile might need fewer appointments, which helps reduce their anxiety and eases the burden on the healthcare system.
This is where the numbers become truly personal. Instead of a standard follow-up schedule for everyone, biostatistics allows for a plan that is carefully calibrated to an individual's unique situation, guiding decisions that are right for them, not just for the 'average' patient.
We've covered the building blocks of cancer research and biostatistics, from clinical trial designs to p-values. But these aren't just abstract ideas. They are the very tools that build the bridge from a promising concept in a lab to a new standard of care in a clinic. Let's see how this actually works.
To bring it all to life, we'll walk through two real-world scenarios. These stories show how biostatisticians, researchers, and patients work together, driving medicine forward one carefully analysed result at a time.
For a long time, the outlook for patients with advanced lung cancer was grim. Then, a new immunotherapy drug came along, one designed to unleash the body's own immune system against cancer cells. To prove it was effective, a large-scale randomised controlled trial (RCT) was essential.
Biostatisticians were involved right from the beginning. They calculated that thousands of patients were needed to get a statistically sound result. They then designed the randomisation process, making sure that each patient had an equal, random chance of receiving either the new immunotherapy or the standard chemotherapy. This step is absolutely critical for preventing bias from skewing the outcome.
As the trial unfolded, biostatisticians were the gatekeepers of the data. Using survival analysis, they meticulously plotted survival curves for both groups, tracking how long patients lived without their cancer getting worse.
After some time, the results were impossible to ignore. The survival curve for the patients on immunotherapy was clearly and consistently higher than the one for the chemotherapy group. The final analysis revealed a hazard ratio of 0.68, which means patients taking the new drug had a 32% lower risk of their disease progressing or of dying compared to those on standard chemo. Just as importantly, the p-value was tiny (less than 0.01), giving everyone confidence that this wasn't just a lucky coincidence.
This rock-solid statistical evidence paved the way for the drug's approval. Today, it’s a standard first-line treatment that has given many people with advanced lung cancer more time and a better quality of life. It’s a perfect example of cancer research and biostatistics turning a trial into a life-changing reality.
Progress doesn't always mean finding a stronger drug. Sometimes, the biggest leap forward is learning when we can safely do less. For a particular group of patients with early-stage breast cancer, the standard of care involved a tough chemotherapy regimen with debilitating side effects. Researchers began to ask: could a gentler, less intensive course of treatment work just as well?
This question led to what’s known as a "non-inferiority" trial. The aim here wasn’t to prove the new regimen was better, but to show that it was not worse than the existing standard.
Again, biostatisticians designed the study, establishing a strict statistical boundary, or margin. If the results for the gentler treatment fell within this margin, it would be officially considered just as effective. Patients were randomised, and their health was followed closely for years. The final numbers showed that the survival rates for both groups were almost identical, falling comfortably within that pre-defined non-inferiority margin.
This discovery was a game-changer. It gave doctors the proof they needed to spare thousands of patients the harshest side effects of intensive chemotherapy, all without lowering their chances of a cure. This dramatically improved their quality of life and set a new, kinder standard of care. This outcome was only possible because meticulous statistical analysis provided the confidence to change medical practice safely.
For anyone navigating their own treatment, learning about the work of a cancer care research centre can offer a deeper understanding of how these vital studies are run.
When you're navigating the world of cancer research, you’re bound to come across a lot of complex information. It's completely natural to have questions. Here, we’ll tackle some of the most common queries from patients and families, offering clear answers to help you make sense of the data and headlines.
With so many stories about medical breakthroughs flying around, it can be really hard to know what to pay attention to. A few key details can help you gauge the quality of a study.
First, see if it’s a randomised controlled trial (RCT). This is generally considered the gold standard in medical research because it’s designed to minimise bias. The size of the study matters, too; a trial with thousands of patients usually provides stronger evidence than one with just a handful. Also, check where it was published – a reputable, peer-reviewed medical journal is a good sign.
But your best first step is always to chat with your oncology team about what you've read. They have the expertise to place the findings in the right context and explain what it might actually mean for you and your treatment plan.
You’ll hear the phrase ‘statistically significant’ all the time in research news. At its core, it just means the result seen in a study, say, a new drug shrinking tumours—is highly unlikely to be a fluke or have happened by random chance. It’s a mathematical way of saying the effect is probably real.
Here’s the critical part, though: a result can be statistically significant without being clinically significant. This means it might not make a meaningful, real-world difference to a patient’s life.
For instance, a new treatment might be shown to extend survival by a statistically significant margin, but in reality, that could mean an average of only a few extra weeks. It's so important to discuss both the statistical numbers and the practical, clinical benefit with your doctor to decide if a treatment’s upsides outweigh the potential side effects for you personally.
It can definitely feel confusing when medical advice seems to shift, but this is actually a fantastic sign. It means that doctors and scientists are constantly learning and relentlessly pushing to find better, safer, and more effective ways to treat cancer.
Medical science is all about continuous improvement. Recommendations evolve for a few key reasons:
This constant forward momentum is powered by cancer research and biostatistics. Every change you see is a careful, deliberate step forward, based on a rigorous analysis of the best evidence we have. It’s proof that your care is always getting better.
We strongly advise you to talk with a health care professional about specific medical conditions and treatments.
The information on our site is meant to be helpful and educational but is not a substitute for medical advice.
Explore the latest cancer research technology transforming patient care. This guide explains genomics, AI, and new treatments in simple, empowering terms.
A clear, hopeful guide for patients and families on cancer research. Learn about study types, new treatments, and how progress is made.
Though most people are supportive about cancer research, there remains a small minority who upholds the idea that cancer research is just one big lie.